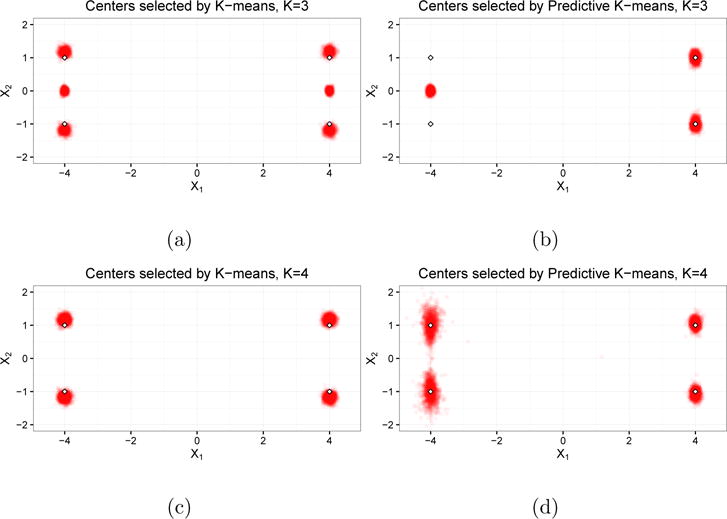
Fig 1.

Cluster centers from Simulation 1. Figures (a) and (c) are the centers identified by regular k-means when K = 3 and K = 4, respectively. Figures (b) and (d) are the centers identified by predictive k-means when K = 3 and K = 4, respectively. Each point in the clouds is a cluster center from a single replication; the outlined diamonds denote the latent cluster centers.
