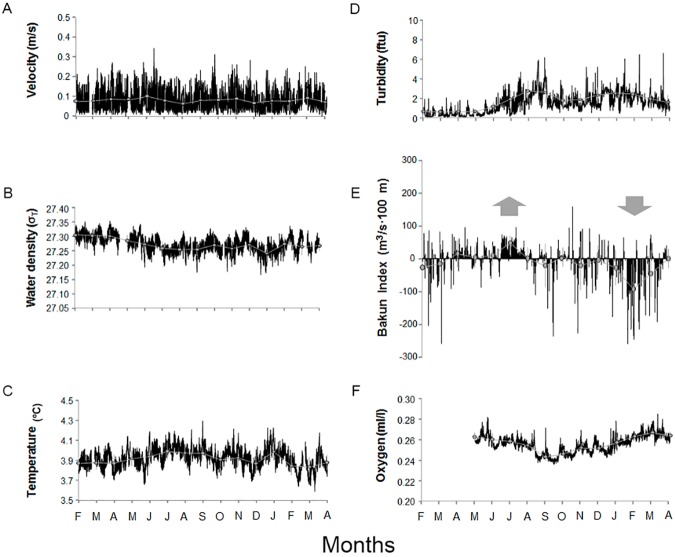
Fig 3. Oceanographic parameters time series (i.e. from 14th February 2013 to 14th April 2014), as recorded by crawler and the nearby POD4 platform within the Barkley Canyon.
Average values (the grey dots) have been reported in order to better highlight the occurrence of seasonal trends. Gaps in data acquisition were due to instrument malfunctioning or downtime for the cabled infrastructure. These parameters are: (A) Velocity; (B) Water Density; (C) Temperature; (D) Turbidity; (E) Bakun Index; and finally, (F) Oxygen. We used up-looking and down-looking arrows to highlight upwelling and downwelling periods respectively.

