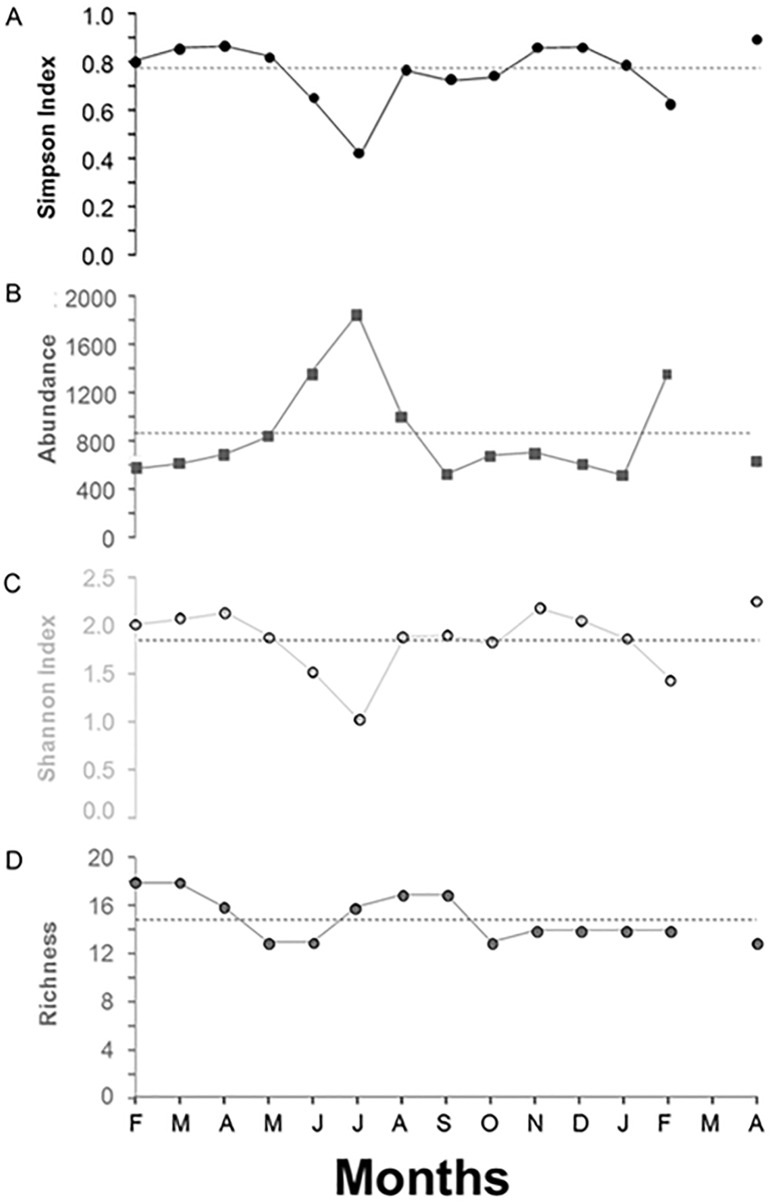
Fig 5. Biodiversity, richness and megafaunal species visual counts (i.e. from 14th February 2013 to 14th April 2014) time series, as reported by crawler video-imaging.
Biodiversity have been reported as mean per month Shannon Index (C) and Simpson Index (A). Similarly, we reported the species richness (D). Abundance (B) was normalized for the maximum transects of the study period (i.e. 48). Horizontal dashed lines correspond to the Midline Estimated Statistic of Rhythm (MESOR).

