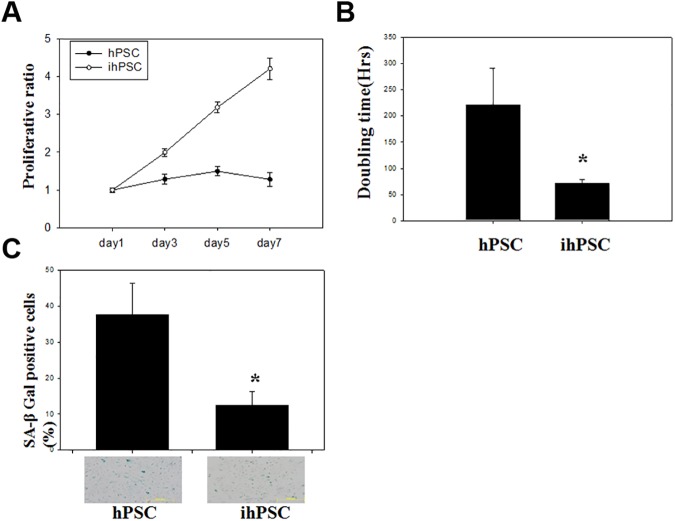
Fig 2. Cell growth and senescence of ihPSC.
(A) A representative growth curve, (B) population doubling time (hrs), and (C) Senescence associated β-galactosidase (SA-β-gal) activity in ihPSC were compared to hPSC. Results are shown as the mean ±SD for three independent experimental cultures. * indicates a significant difference with P<0.01.

