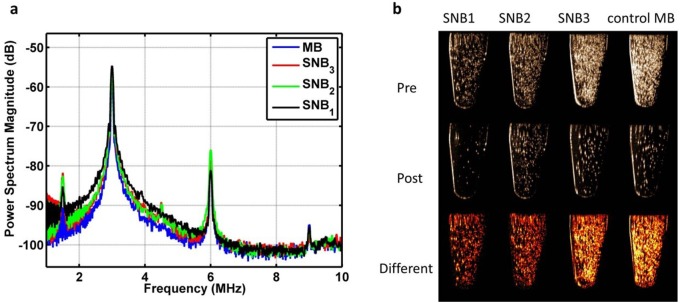
Fig 4. Nonlinear imaging and bubble destruction.
(a) Power spectrum of signals backscattered from different SNBs and control MBs in response to 3 MHz transmitted pulses. Each point on the spectrum represents an average of 90 points from three samples (30 points per sample). (b) Ultrasound images of different SNBs and control MBs acquired before (Pre) and after (Post) destruction pulse ultrasound sequence, and the difference (Difference) between these images.

