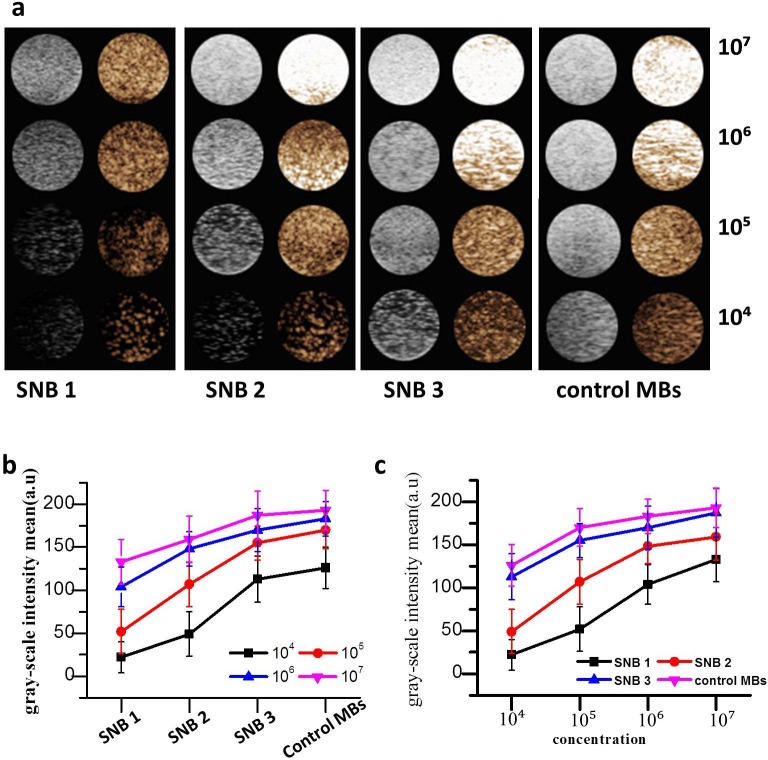
Fig 5. In vitro ultrasound imaging.
(a) Ultrasound imaging of three different SNBs and control MBs in vitro. 1×10⁴, 1×10⁵, 1×10⁶ and 1×10⁷ on the right side of the figure mean the bubble concentrations. (b) Quantitative analysis of the B-mode signal intensities of SNBs and control MBs at different concentrations.

