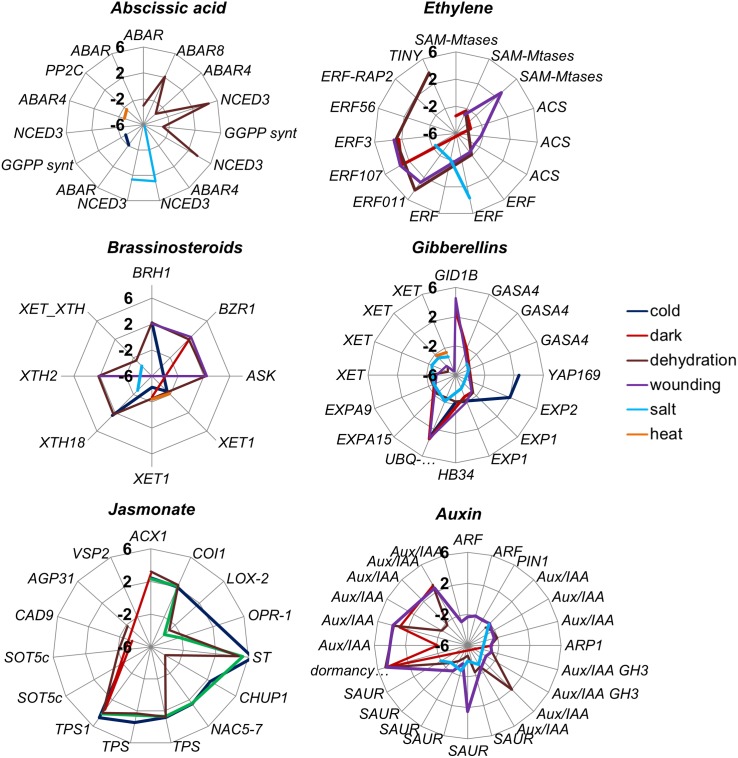
Fig 4. Radar graph representing differentially expressed genes involved in hormone biosynthesis and response.
Each concentric ring represents log2FC increase or decrease, where axes represent maximum FC = +6 (outer ring), minimum FC = –6 (central point) and zero as no change. Stress treatments are presented by different colors.

