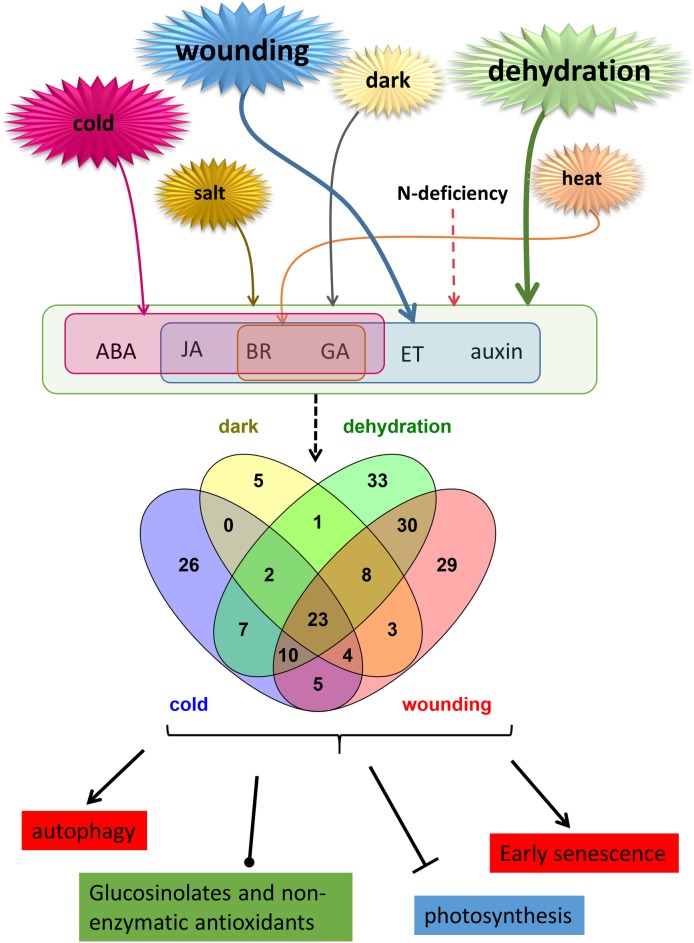
Fig 7. Model illustrating the overlapping effects of 24h stress treatments on PGR signaling, TF expression and down-stream processes.
Stress font size indicates the importance of each stress in altering gene expression. Shaded Venn diagram circles indicate number of TFs from the major families identified from the transcriptome (MYB, WRKY, bHLH, AP2, bZIP, NAC, AUX-IAA, Zf-C2H2, GATA and homeobox domain) whose expression changes in response to overlapping postharvest stresses.

