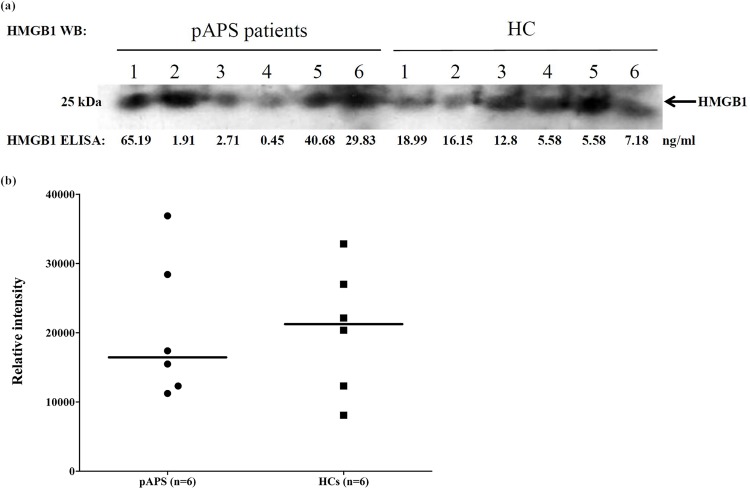
Fig 2. Comparisons of plasma levels of HMGB1 measured by Western blot between pAPS patients and HCs.
(a) Poor correlation of ELISA with Western blot in the measurement of plasma levels of HMGB1 in both pAPS patients and HCs. (b) Comparison of plasma levels of HMGB1 between pAPS patients and HCs. Band intensities were quantified by ImageJ. HC, healthy control; HMGB1, high-mobility group box 1; pAPS, primary antiphospholipid syndrome; WB, Western blot.

