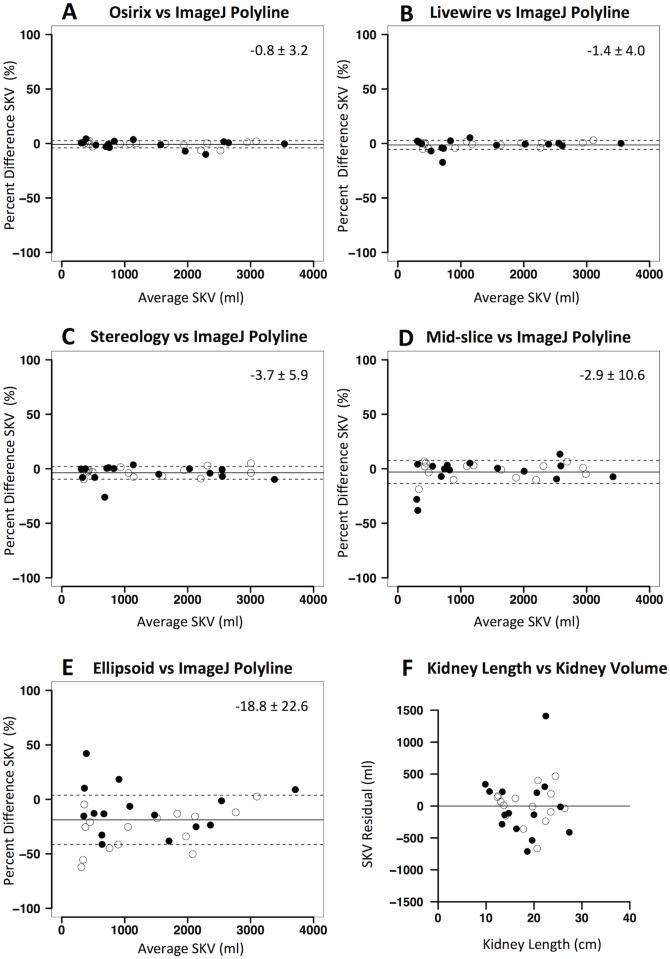
Fig 3. Agreement between kidney volume computation methods on MR in the experimental dataset.
Panels A-E: Bland-Altman plots showing agreement between different kidney volume computation methods (A: Osirix free-hand; B: Livewire tool; C: Stereology; D: Mid-slice method; E: Ellipsoid method) versus ImageJ polyline (reference method). Percent differences in single kidney volume (SKV) are plotted against average SKV values of the two methods. Solid lines denote mean difference, while dashed lines denote ± standard deviations. Panel F: plot of the residual of the linear regression of kidney length against SKV (assessed by reference ImageJ polyline method). Black dots represent right kidneys while white dots represent left kidneys.

