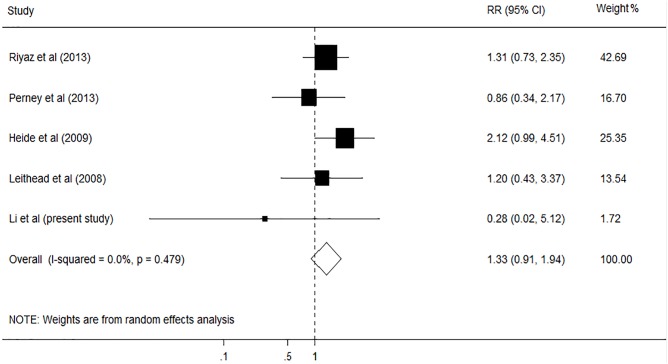
Fig 2. Forest plot on the associations between cigarette smoking and hepatic artery thrombosis after liver transplantation.
The boxes and lines indicate the relative ratios (RRs) and their confidence intervals (CIs) on a log scale for each study. The pooled RR is represented by a diamond. The size of the black squares indicates the relative weight of each estimate.

