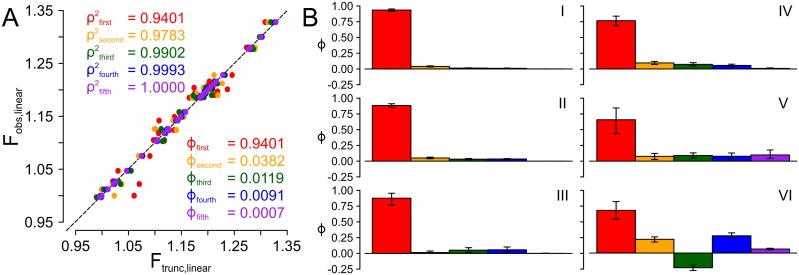
Fig 1. Contributions of epistasis to variation in fitness.
Panel A: Correlation between observed (linearized) fitness and fitness calculated for truncated epistasis models for dataset I. Each point on the plot is a single genotype-fitness pair; the dashed line is a 1:1 line. Colors correspond to the truncation order: to first (red), second (orange), third (green), fourth (blue), and fifth (purple). ρ2 and ϕ for each order are shown on the plot, colored by order. Panel B summarizes the contributions of each order of epistasis to the variation in fitness for all six datasets. Dataset is indicated with roman numeral. Colors follow panel A.

