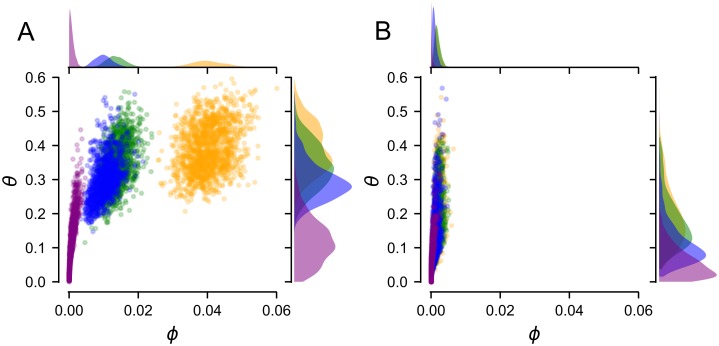
Fig 3. Changes in trajectories are not the result of experimental uncertainty.
Data in panel A and B are for dataset I. Panel A shows the distribution of ϕ and θ for 10,000 pseudoreplicates generated by sampling uncertainty in each the fitness of each genotype (S2A Fig). Colors denote order of epistasis, as in Fig 1. Panel B shows the epistasis extracted from datasets without epistasis, but experimental uncertainty (S2B Fig).

