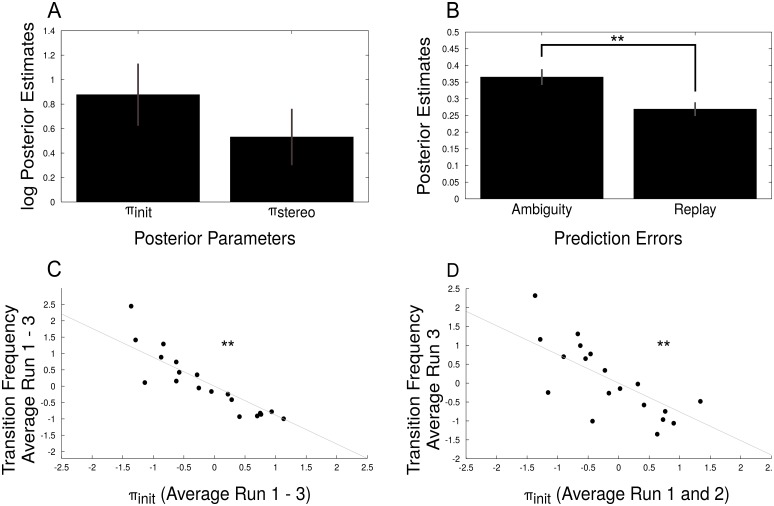
Fig 3. Posterior model parameters.
A: The geometric mean (i.e. the arithmetic mean in log-space) of posterior πinit and πstereo, averaged across runs and participants, and standard error of the mean. B: Mean prediction errors averaged across runs and participants for ambiguous and replay blocks and standard error of the mean. Prediction errors were significantly decreased during replay stimulation (two-sample t-test, p < 10−6, t19 = 7.69). C: Average transition probabilities correlated significantly with average πinit for individual participants (ρ = −0.88, p < 10−7, Pearson correlation), providing a sanity check for model fit. D: Transition probabilities from run 3 were predictive of posterior πinit averaged over run 1 and 2. The significant Pearson correlation between the two independent measures (ρ = −0.76, p < 10−4) illustrates the predictive power of the model.

