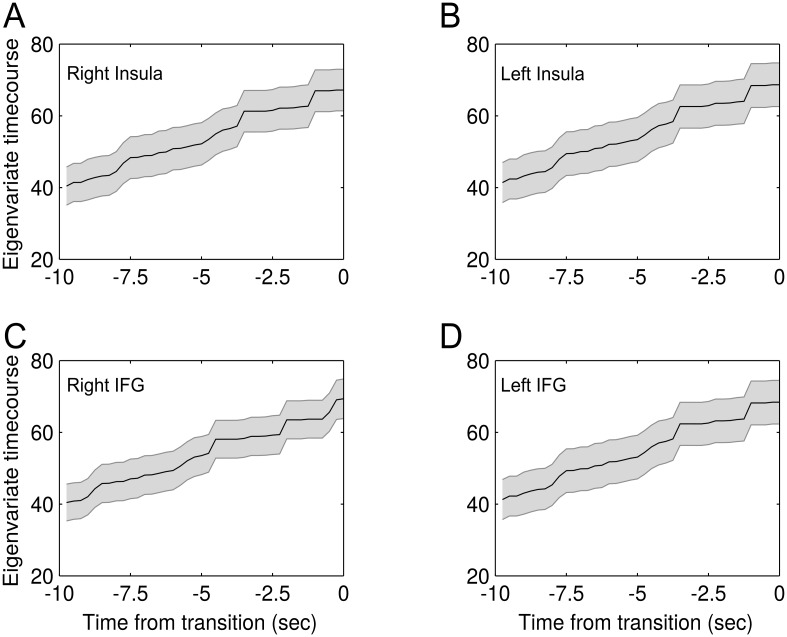
Fig 5. Average eigenvariate time-courses.
For visualization, we extracted eigenvariate time-courses from right insula, left insula, right IFG and left IFG (A–D), aligned all phase durations to the timepoint of the upcoming perceptual transition and averaged within and across observers. In analogy to modelled prediction error trajectories, mean eigenvariate time-courses (± standard error of the mean) showed a gradual increase towards a transition in perception.

