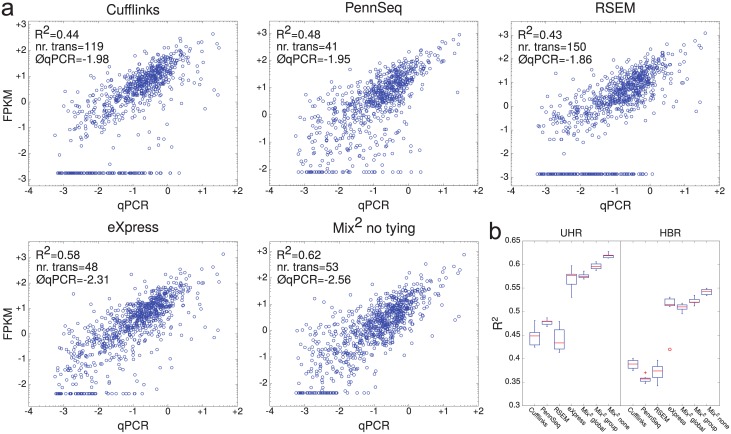
Fig 5. Correlation between qPCR and FPKM.
(a) Typical lane on UHR for each of the 5 methods. The R2 value of each lane corresponds to the median of the R2 values over all 7 lanes of the respective method. The straight line of points at the bottom of the graphs represents the truncated FPKM values, whose corresponding transcripts can be considered not detected. The number of not detected transcripts and the average logarithm of their qPCR values are also given in the graphs. (b) Boxplots of R2 value over all 7 lanes of UHR and HBR.

