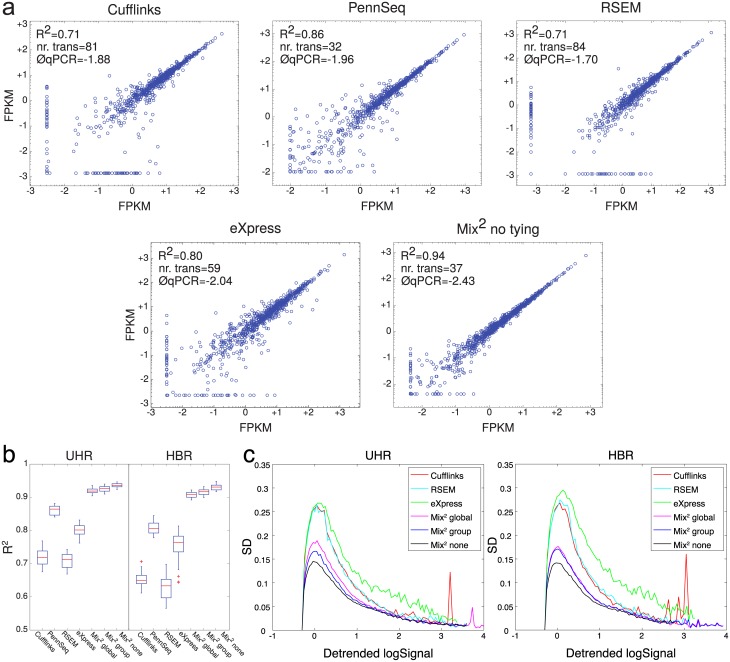
Fig 6. Repeatability of FPKM measurements for identical transcripts and samples in different lanes.
(a) Typical lane pairs on UHR for each of the 5 methods. The R2 value of each lane pair corresponds to the median of the R2 values over all 21 lane pairs of the respective method. The straight lines of points at the bottom and the left side of the graphs represent transcripts detected in one lane but not the other. The number of these transcripts and the average logarithm of their qPCR values are also given in the graphs. (b) Boxplots of R2 value over all 21 lane pairs of UHR and HBR. (c) Variance based measure of repeatability. X-axis shows the average of the detrended log FPKM values. Y-axis shows the median standard deviation for all transcripts within one bin. X-axis was divided into 100 bins.

