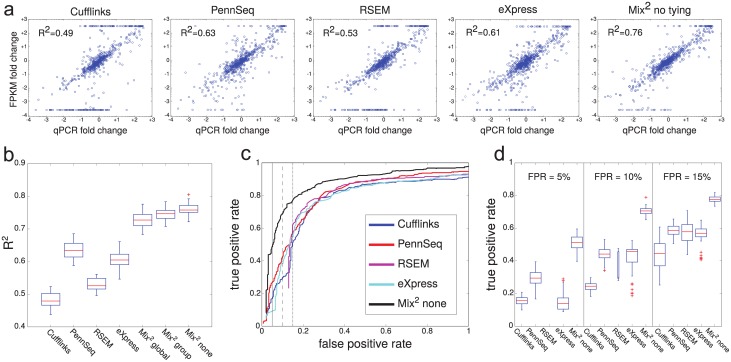
Fig 7. Correlation of qPCR and FPKM fold changes between UHR and HBR and accuracy of differential expression detection.
(a) Typical lane pairs for each of the 5 methods. The R2 value of each lane pair corresponds to the median of the R2 values over all 49 lane pairs of the respective method. FPKM fold changes were truncated if they were larger or smaller than the maximal or minimal qPCR fold change. The straight lines of points at the top and bottom of the graphs represent truncated FPKM fold changes. (b) Boxplots of R2 value over all lane pairs in UHR and HBR. (c) ROC curves for classification experiment regarding differentially expressed transcripts in the lane pairs in (a). The vertical lines correspond to false positive rates of 5%, 10% and 15%. (d) Boxplots of true positive rates of classification experiment on all 49 lane pairs in UHR and HBR for false positive rates of 5%, 10% and 15%.

