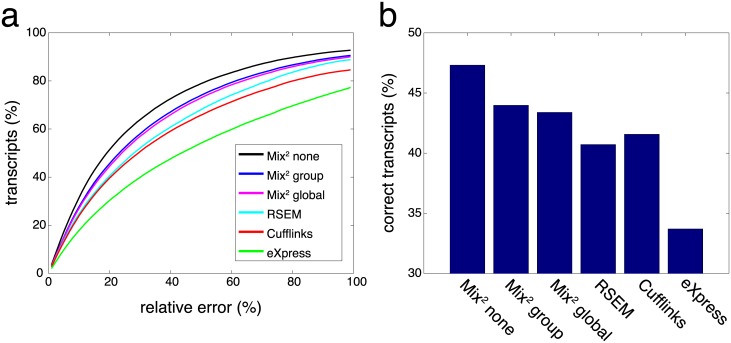
Fig 8. Evaluation on built-in ground truths of SEQC data set.
(a) Relative error of predicted C/D ratio vs. measured C/D ratio. Y-axis shows the percentage of transcripts having a relative error less than value on x-axis. (b) Titration order consistency. Y-axis shows the percentage of transcripts with correct titration order.

