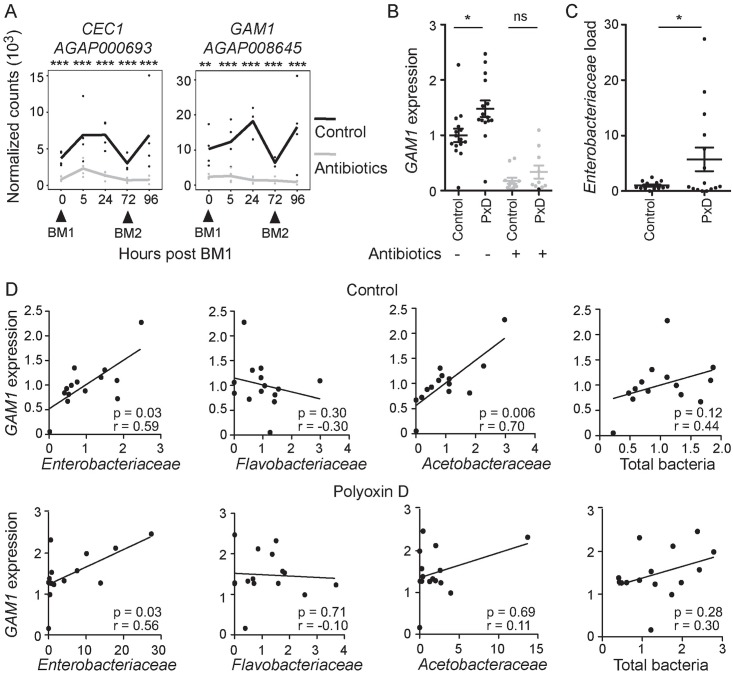
Fig 3. The peritrophic matrix regulates immune resistance to the microbiota.
(A) RNA-seq transcriptional profiles of CEC1 and GAM1 in the midgut of control (black lines) and antibiotic fed (grey lines) mosquitoes over a two blood meal (BM1 and BM2) time course. Dots indicate normalized counts in each of four biological replicates, with the line connecting the means. Statistical significance of a pairwise comparison of counts at each time point was assessed by a Wald test with a Benjamini-Hochberg correction. ‘*’ p<0.05; ‘**’ p<0.01; ‘***’ p<0.001 (B) GAM1 expression, relative to AgS7, in the midgut 24h after feeding with blood supplemented with 100μM polyoxin D (PxD) or an equal volume of water (control), plus or minus antibiotic treatment, as determined by qRT-PCR. Mean plus/minus standard error is indicated. Statistical significance was assessed by an ANOVA on a linear mixed effect regression model. Each dot represents a pool of 8–10 guts, derived from 4–5 independent experiments. Ratios are normalized within biological replicates to the mean of the control pools (no polyoxin D, no antibiotics). (C) Enterobacteriaceae load, relative to AgS7, as determined by qRT-PCR using Enterobacteriaceae specific 16S primers. Normalization and statistical analysis were performed as described for (B). (D) Scatter plots of the load of specific bacteria families commonly found in the mosquito gut against GAM1 expression in the midguts of control (top row) or polyoxin D-treated (bottom row) mosquitoes. Spearman’s rank correlation coefficient (r) and associated p-values (p) are indicated.

