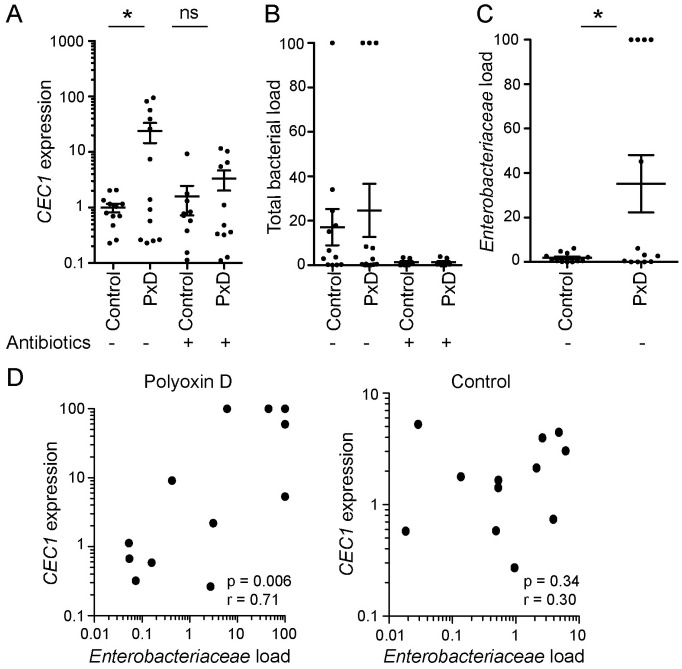
Fig 5. The peritrophic matrix prevents microbiota dissemination and systemic immune induction.
(A-C) CEC1 expression (A), 16S rRNA quantification (B) and Enterobacteriaceae 16S rRNA quantification (C) in the carcass 72h after feeding with a blood meal supplemented with 100μM polyoxin D or water as a control, plus or minus antibiotic treatment, as determined by qRT-PCR. Each dot represents a pool of 8–10 carcasses, derived from 4 independent experiments. Data show mean and standard error. In A, ratios are normalized within biological replicates to the mean of the control pools (no polyoxin D, no antibiotics). In B-C, ratios are normalized within each biological replicate to the highest value across all conditions (‘100%’). In A-C, statistical significance was assessed by an ANOVA on a linear mixed effect regression model. (D) Scatter plots of relative Enterobacteriaceae load against CEC1 expression in the carcass at 72h post blood feeding. Each dot represents a pool of 8–10 carcasses, derived from 4 independent experiments; data are normalized as in B and C. Spearman’s rank correlation coefficient and associated p-values are indicated. ‘*’ p<0.05.

