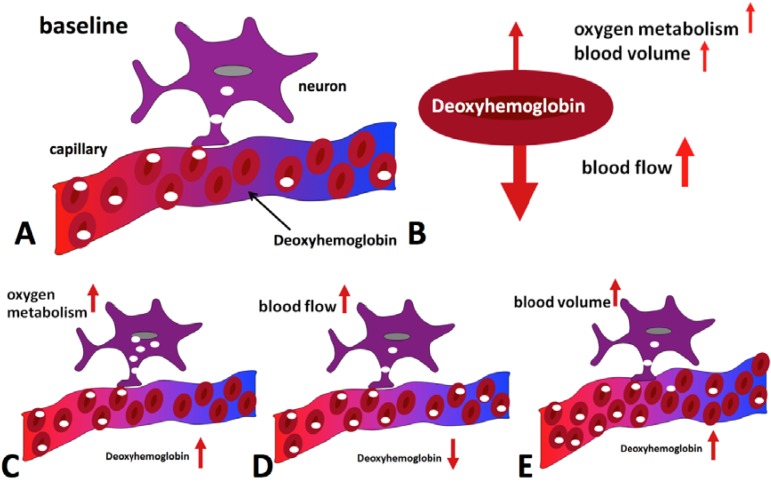
Figure 2.
Hemodynamic effects contributing to the BOLD signal during activation. Panel (A) shows the situation in the baseline state, with only some of the delivered oxygen being utilized. The diagrams at the bottom illustrate the effect of oxygen metabolism (C), blood flow (D) and blood volume (E) increases on deoxyhemoglobin concentration. Blood flow increase dominates, leading to a net reduction of deoxyhemoglobin (B) and an increase in MR signal is hence observed.

