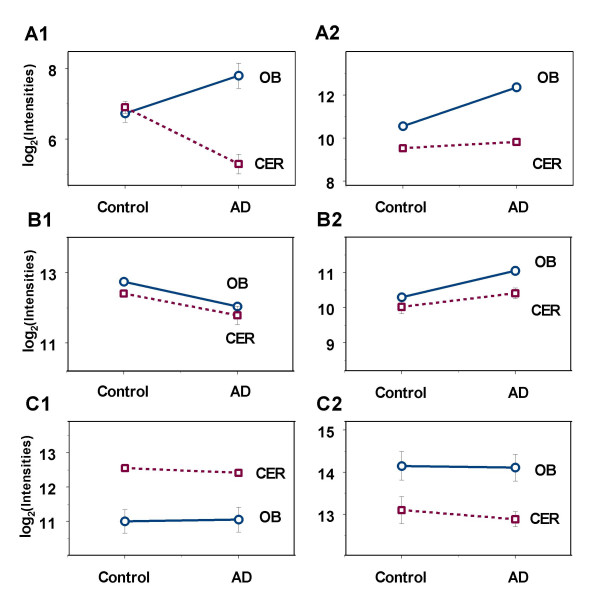
Figure 1.
Simple diagrams to illustrate significant interaction, main effects of Disease and Region. The average log transformed intensities under control and AD conditions for both OB and CER were plotted together for each gene with either significant interaction or main effects. The two points from each region were connected using a straight line and the non-parallel lines imply interaction. Two examples genes with interaction effect were shown in A. A1, represents a directional interaction and A2 indicates an interaction in magnitude. Two genes with only main effect of disease were illustrated in B, one of which showed down-regulation in AD (B1), while the other genes were upregulated in AD for both OB and CER. In the bottom panel, two genes with only regional differences were shown. The gene in C1 has high expression level in CER, and the gene in C2 has an opposite situation. See also Table 4, 5.

