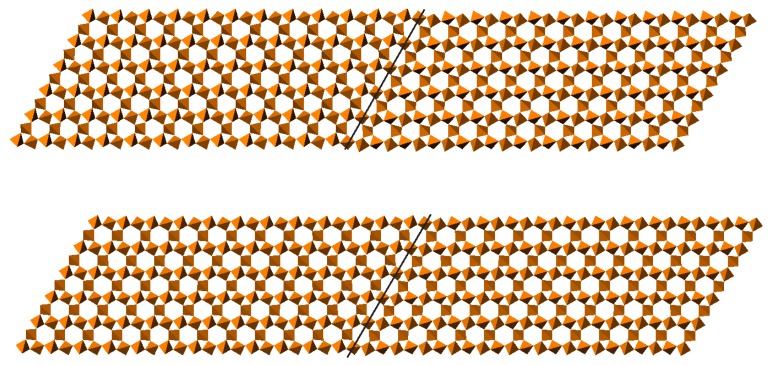
Figure 4.
Structural models of domain walls in quartz, viewed down the crystallographic c axis (from [12]). The upper panel shows a geometrically relaxed configuration using -quartz cell parameters, in which the domain wall (indicated by line) shows an elliptical channel profile. The lower panel shows a geometrically relaxed configuration using cell parameters from the incommensurate phase near the – phase transition; the domain wall is less distinct.

