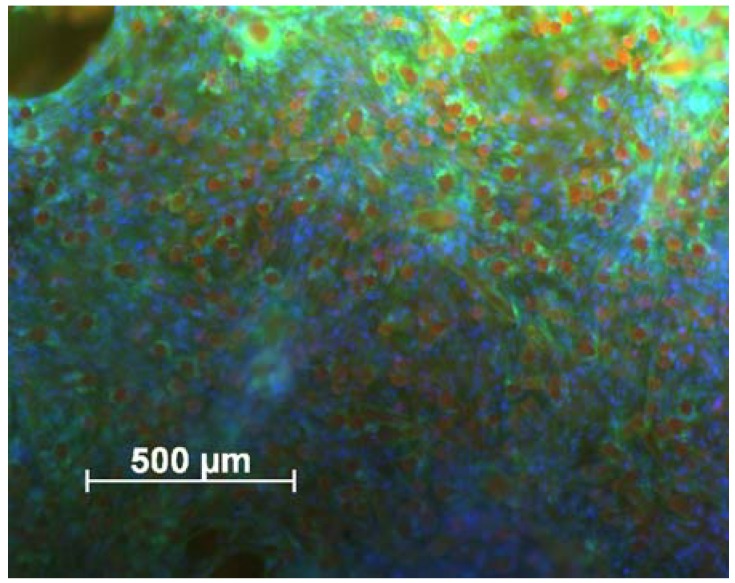
Figure 9.
cLSM image of the scaffold surface 28 days after cell seeding. Cells were stained with DAPI/phalloidine. Actin fibers of cells appear green and nuclei of cells blue. Fibers of flock scaffold show up red because of their autofluorescence. The cells are distributed homogeneously over the surface. Scale bar represents 500 µm.

