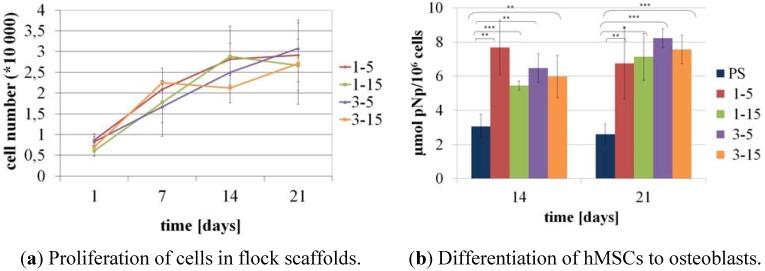
Figure 10.
Proliferation and differentiation of hMSC in flock scaffolds with different fiber lengths and fiber distances. (a) Proliferation of osteogenically induced hMSC shown with the DNA-content of the scaffolds at time points 1, 7, 14, 21 days after seeding; (b) Specific ALP-activity of osteogenically induced hMSC on day 14 and 21 of cultivation. Graphs show mean (n = 3 bioconstructs) and standard deviation of the mean. *** p < 0.001; ** p < 0.01; * p < 0.05.

