
Figure 3.
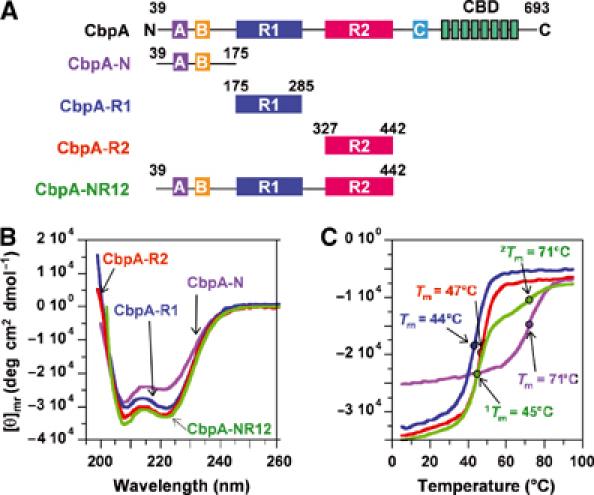
Secondary structure of CbpA domains. (A) CbpA constructs used in this study. (B) CD spectra for CbpA-N (violet trace), -R1 (blue trace), -R2 (red trace) and -NR12 (green trace). (C) Thermal denaturation traces obtained by measuring CD ellipticity at 222 nm at different temperatures. The coloring scheme is as in (B).