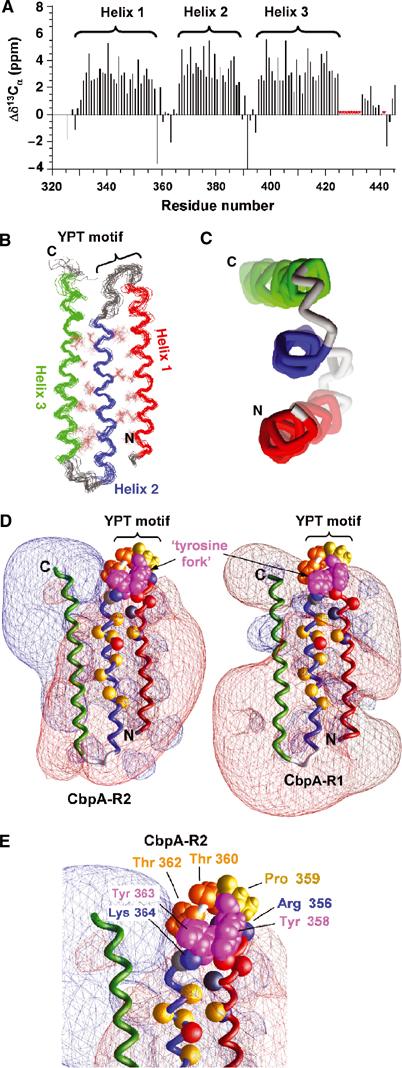
Figure 4.

Solution structure of CbpA R domains. (A) Secondary 13Cα chemical shift values for CbpA-R2 showing the three α-helices. Resonances for residues marked by red asterisks are unassigned. (B) Superposed ensemble of 20 lowest-energy structures of CbpA-R2 obtained from solution NMR data; the backbone and select hydrophobic residues (in brown color) at the two α-helix/α-helix interfaces are illustrated. Helix 1 is colored red, Helix 2 blue and Helix 3 green. The location of the YPT motif is noted. (C) End-on view of the three α-helices of domain R2, colored as in (B). (D) Contour maps of electrostatic potentials (±1kt; red, negative potential; blue, positive potential) for CbpA-R2 (left) and homology model of CbpA-R1 (right) generated using GRASP (Nicholls et al, 1991). The α-helices are colored as in (B). Tyr 358 and 363 (magenta; labeled ‘tyrosine fork'), Pro 359 (yellow) and Thr 360 and 362 (orange) are also illustrated. The Cα atoms of other conserved residues are illustrated as colored spheres (Lys 346, Arg 356 and Lys 364 (blue); Glu 352, Asp 354 and Glu 372 (red); Gln 350 and Thr 365 (gray); Ala 347, Ile 368, Ile 370, Ala 371, Val 375, Val 377, Ala 80 and Leu 382 (yellow)). (E) Close-up view of conserved residues in loop between Helix 1 and Helix 2 of CbpA-R2 that protrude into a region of neutral electrostatic potential. Key residues are illustrated as in (D).
