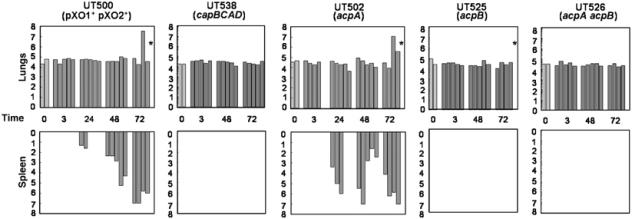
Figure 1.

Dissemination of UT500 and isogenic mutant strains in mice. At time=0, mice were infected with 4 × 10⁴ spores. Each bar represents data from one mouse. The y-axis is shown on a logarithmic scale and indicates CFU detected. Data shown are representative of at least three independent experiments. For UT500 and UT502 (acpA), five time points are shown to illustrate early dissemination, beginning 24 h postinfection for some mice. *One mouse died between 48 and 72 h.
