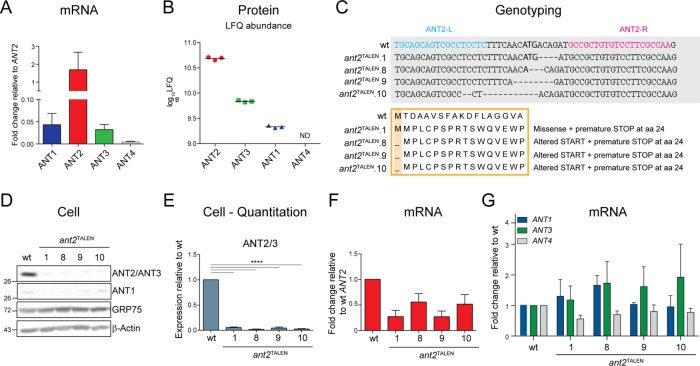
FIGURE 4:
Generation of an ant2-null cell model using TALEN-mediated gene disruption. (A) Relative mRNA level of ANT isoforms in 293 Flp-In (wt). Data were analyzed by the comparative CT (ΔΔCT) method, represented as mean fold change (2-ΔΔCT) ± SEM (n = 4) relative to ANT2 expression, which was set to 1. (B) Mass spectroscopy–based quantitation of relative protein abundance of ANT isoforms in wt mitochondria. The log10 label-free quantification (LFQ) signal intensities. ANT4 was not detected. n = 3. (C) TALEN-mediated disruption of ANT2 in wt cells introduces nucleotide deletions that alter the start site and result in premature ANT2 translation termination in all four ant2TALEN clones. (D) Whole-cell extracts (50 μg) from wt and ant2TALEN clones immunoblotted with ANT2/ANT3- and ANT1-specific antibodies. (E) Densitometry analyses of ANT2/ANT3 expression in cell extracts from D. Expression relative to wt ± SEM (n ≥ 4). (F) Relative mRNA levels of ANT2 in ant2TALEN clones analyzed by the ΔΔCT method, represented as mean fold change compared with wt ± SEM (n = 4). (G) Relative mRNA levels of ANT1, ANT3, or ANT4 in ant2TALEN clones analyzed by the ΔΔCT method, represented as mean fold change compared with wt ± SEM (n ≥ 4).

