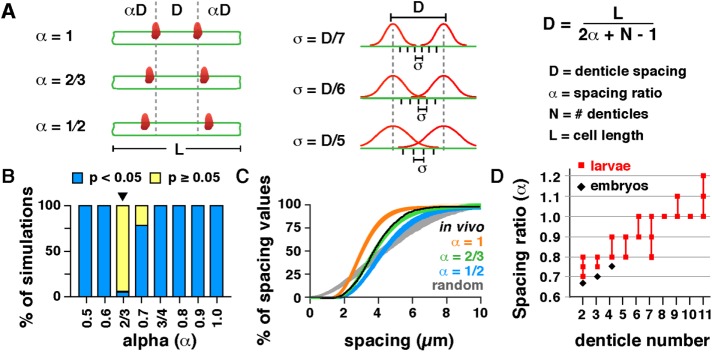
FIGURE 2:
A statistical model recapitulates key features of denticle scaling. (A) Models for denticle spacing (D) varying the spacing ratio (α) and SD (σ). Cell length (L) and denticle number (N) were measured in vivo. (B) Percentage of simulations that were significantly different from (p < 0.05, blue) or consistent with (p ≥ 0.05, yellow) in vivo distributions. Plot varies α for σ = D/6. The α = 2/3, σ = D/6 model (arrowhead) was most similar to the data for wild-type (WT) embryos (p ≥ 0.05 in 94.1% of simulations, Kolmogorov-Smirnov test). (C) Cumulative distribution plot for models varying the spacing ratio (α) for σ = D/6. One thousand simulations are shown for each model. Black line, in vivo measurements for WT embryos. (D) The spacing ratio (α) increases with increasing denticle number in embryos (black) and larvae (red). See the Supplemental Tables for a summary of the modeling outcomes in B and C (Supplemental Table S5) and D (Supplemental Table S6).

