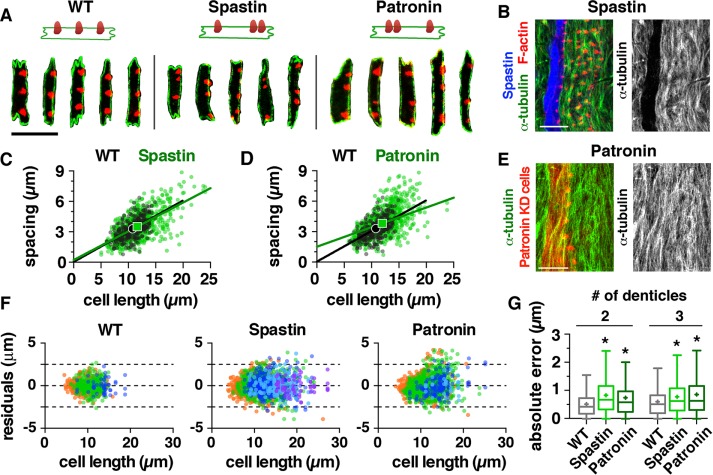
FIGURE 7:
Microtubules are required for denticle organization. (A) Column 1 cells from wild-type (WT), Spastin-overexpressing (Spastin-OE), and Patronin knockdown (Patronin-KD) embryos. F-actin (phalloidin, red), E-cadherin (green). (B) Spastin-GFP overexpression with the en-Gal4 driver depletes microtubules in column 1. Green (α-tubulin), red (F-actin), blue (Spastin-GFP). Scale bar: 10 µm. (C, D) Denticle spacing vs. cell length for column 1 cells with three denticles in WT (black) and Spastin-OE or Patronin-KD (green) embryos. Lines, best-fit linear regressions; symbols, means. Data points outside the x- and y-axis ranges (a maximum of 0.3% of the data points in each plot) are not shown. (E) Expression of a Patronin short hairpin RNA transgene using en-Gal4 does not affect the overall organization of column 1 microtubules. Green (α-tubulin), red (Moesin-mCherry labels en-Gal4-expressing cells). Scale bar: 10 µm. (F) Residuals for the best-fit linear regressions for WT, Spastin-OE, and Patronin-KD. Colors indicate cells with two (orange), three (green), four (dark blue), five (light blue), or six denticles (purple). (G) Absolute error of spacing relative to the best-fit linear regressions. Boxes, 25th–75th percentile; whiskers, 1.5 interquartile range (IQR); horizontal line, median; +, mean. *, p < 0.001 compared with WT, Kruskal-Wallis test with Dunn’s multiple comparison test. See the Supplemental Tables for mean ± SD values (Supplemental Table S1), n values (Supplemental Table S2), and best-fit linear regression equations and R2 values (Supplemental Table S3).

