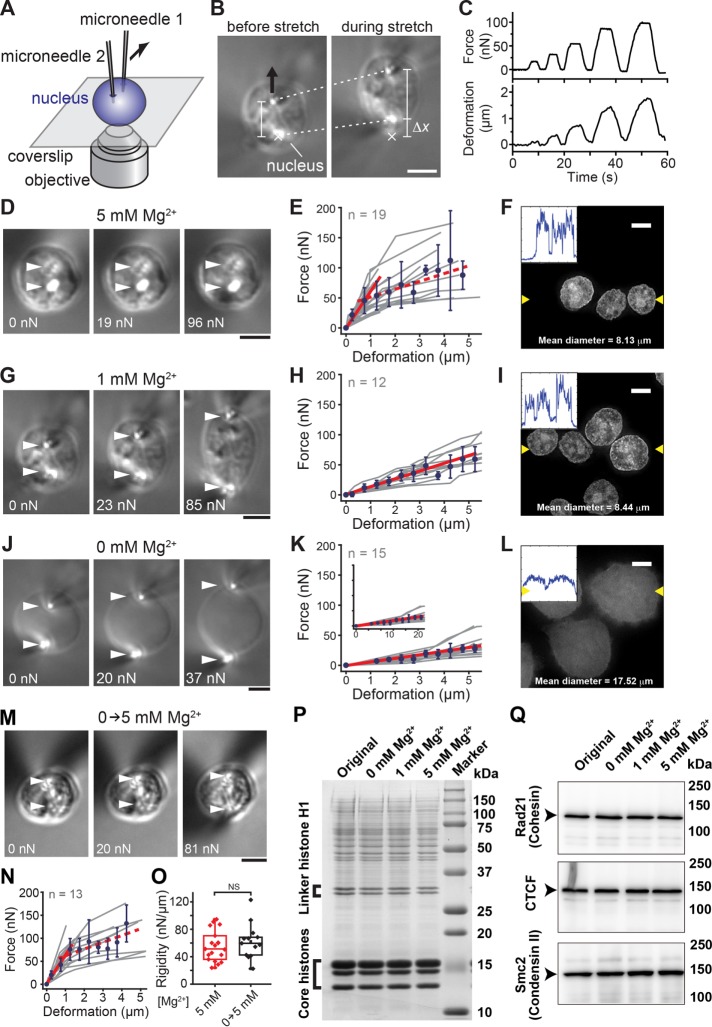
FIGURE 1:
Mg2+-induced stiffening of nuclei associated with chromatin compaction. (A) Schematic of the setup for measuring the mechanical response of nuclei. (B) Bright-field images of a micromanipulated nucleus. The nucleus isolated from a HeLa cell line was deformed by moving the upper microneedle (black arrow) while monitoring the magnitude of applied force, which was estimated based on deflection of the force-calibrated microneedle tip (Δx) from its equilibrium (marked ×). Dotted lines show positions of the microneedle tips, which were used to estimate the extent of deformation. (C) Typical time recordings of the measurement showing cycles of stretch-hold-release with varying force magnitudes. (D, G, J) Images of isolated nuclei exposed to buffers with indicated Mg2+ levels and stretched at indicated force magnitudes. Arrowheads, microneedle tip positions. (E, H, K) Force–deformation plots obtained at Mg2+ levels of 5 mM (n = 19) (E), 1 mM (n = 12) (H), and 0 mM (n = 15) (K). Data from individual nuclei (gray lines) were pooled for 0.5-µm bins and averaged (bars represent SD). Slopes are 63.1, 13.5, and 5.5 for E, H, and K, respectively (red solid lines; R2 > 0.97). The red broken line shows the region of predominant viscous deformation (slope, 14.5). (F, I, L) Images of DAPI-stained nuclei. Insets, intensity line profiles generated across two yellow arrowheads in each image. (M–O) Reversibility of nuclear mechanical response. (M) Images showing an isolated nucleus, which was preincubated in 0 mM Mg2+ buffer and then exposed to 5 mM Mg2+ buffer. The nucleus was stretched using the microneedle-based setup at indicated force magnitudes. (N) Force–deformation plot. Data from those nuclei (gray lines, n = 15) were pooled for 0.5-µm bins and averaged (blue circles; bars represent SD). Slope, 60.2 (R2 = 0.99; red solid line). (O) Nuclear rigidity of untreated control nuclei (red) and nuclei once exposed to 0 mM Mg2+ buffer (black). NS, not significant by Student’s t test (p = 0.42). (P) CBB staining of overall nuclear components at different Mg2+ levels. (Q) Western blot of major interphase chromatin assembly factors. Scale bars, 5 µm.

