FIGURE 3:
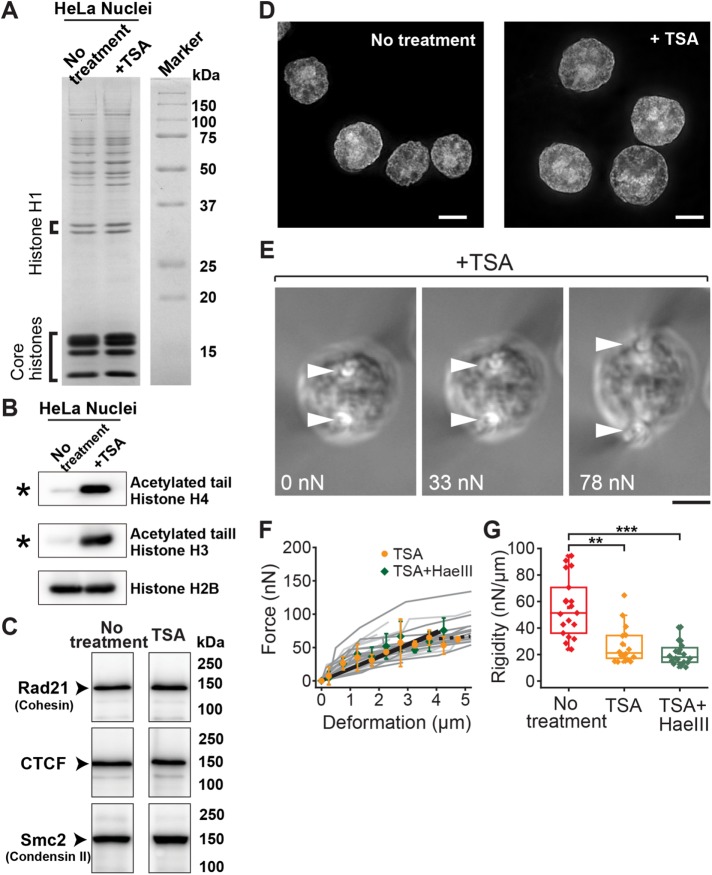
Histone tail acetylation leads to loss of nuclear rigidity. (A) CBB staining showing abundance of major nuclear components, including linker and core histones, for untreated control and TSA-treated cells. (B, C) Western blot analyses showing hyperacetylation of histone H3 and H4 tails in TSA-treated nuclei (B; asterisk) and abundance of key chromatin assembly factors (C; no treatment data correspond to the right-most lane in Figure 1Q; see Supplementary Figure S4B for full-size scan of blots). (D) Representative images of DAPI-staining in untreated control (left; reproduced from Figure 1F) and TSA-treated (right) nuclei. (E) Bright-field images of a TSA-treated nucleus exposed to 5 mM Mg2+ buffer and stretched at indicated force magnitudes. Marks are as in Figure 1. (F) Force–deformation plots obtained for nuclei treated with TSA (orange circles, n = 16) and those treated with TSA and HaeIII (green diamonds, n = 20). Individual measurements (dark and light gray lines, respectively) were pooled for 0.5-µm bins and averaged (bars represent SD). Slopes are 18.7 and 19.0, respectively (black solid lines; R2 > 0.92). The broken line shows the region of predominant viscous deformation. (G) Summary of nuclear rigidity measurements of untreated control (red; corresponding to data in Figure 1O), TSA-treated (orange), and TSA/HaeIII-treated (green) nuclei. **p < 0.001, ***p < 0.0001 (Student’s t test). Scale bars, 5 µm.

