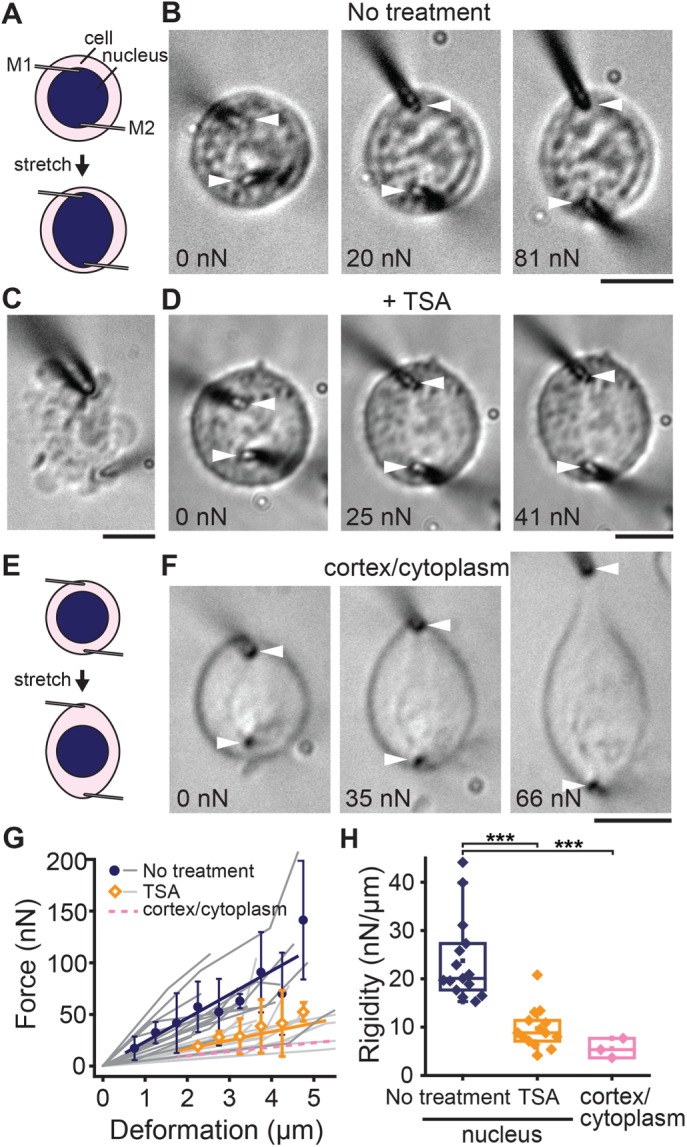
FIGURE 4:

In situ measurement of the nuclear mechanical response. (A) Schematic showing the experimental setting for measuring the nuclear mechanical response in living cells. (B) DIC images of a HeLa cell from suspension culture, the nucleus of which was captured by inserting the tips of microneedles (white arrowheads) into the cells and then stretched at indicated force magnitudes. (C) An unsuccessful measurement. A cell exhibited significant blebbing upon micromanipulation. (D) A TSA-treated HeLa cell, the nucleus of which was stretched as in B and at indicated force magnitudes. Schematic (E) and representative images (F) of a HeLa cell stretched at near the cell periphery but not capturing the nucleus. (G) Force–deformation plot obtained from measurements in untreated control cells (blue circles, n = 20) and cells treated with TSA (orange diamonds, n = 15). Plots are mean ± SD. Linear regression yields slopes of 22.9 and 8.3, respectively. Data from individual samples are shown in dark and light gray, respectively. Also shown is the level of cytoplasm stiffness estimated as in F (pink dashed line). (H) Summary of in situ nuclear rigidity measurement for untreated control cells (n = 20), cells treated with TSA (n = 15), and cytoplasm (n = 3). ***p < 0.0001. Scale bars, 5 µm.
