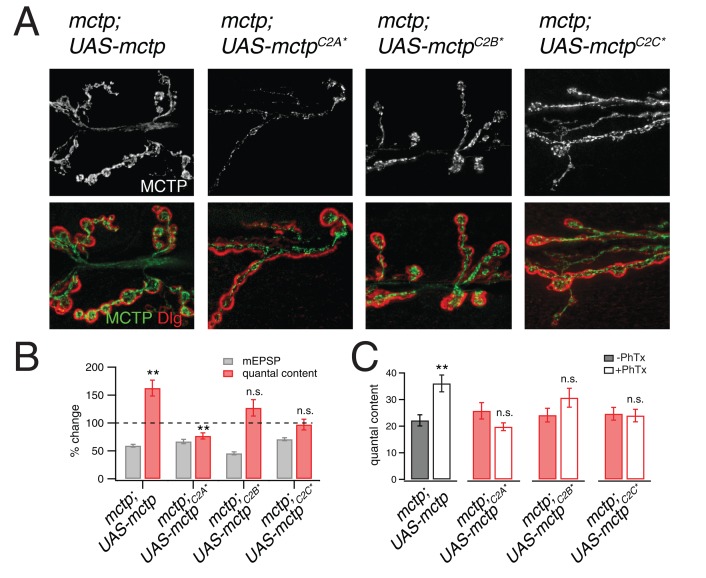
Figure 10. Evidence that MCTP is an ER localized calcium sensor.
(A) Representative images of the NMJ showing the expression of epitope tagged mctp transgenes (UAS-mctp-Flag). At top (black and white) are images of MCTP-Flag at the NMJ. Below, staining is shown for MCTP (green) and anti-Dlg (red). Sequentially, moving to the right are images for expression of mutant UAS-mctp-flag transgenes in the mctpOG9 mutant background. Each transgene harbors mutations in an individual C2 domain, either in the C2A domain (C2A*), the C2B domain (C2B*) or the C2C domain (C2C*, at far right). In all cases, the elav-Gal4 driver is used to express transgenes in neurons in the mctpOG9 mutant. (B) Average percent changes in mEPSP amplitude (filled bars) and quantal content (open bars) for the indicated genotypes (mctp, mctpC2A*, mctpC2B*, mctpC2C*) in the presence of PhTx compared to baseline. (C) Quantification of mEPSP amplitudes and quantal content for mctp (-PhTx, n = 10; +PhTx, n = 10), mctpC2A* (-PhTx, n = 14; +PhTx, n = 8), mctpC2B*(-PhTx, n = 6; +PhTx, n = 9), mctpC2C* (-PhTx, n = 14; +PhTx, n = 10). Student’s t-test ** for p<0.01, * for p<0.05, n.s. for p>0.05.

