
Figure 6. Action-potential induced calcium influx is normal in the mctp mutant.
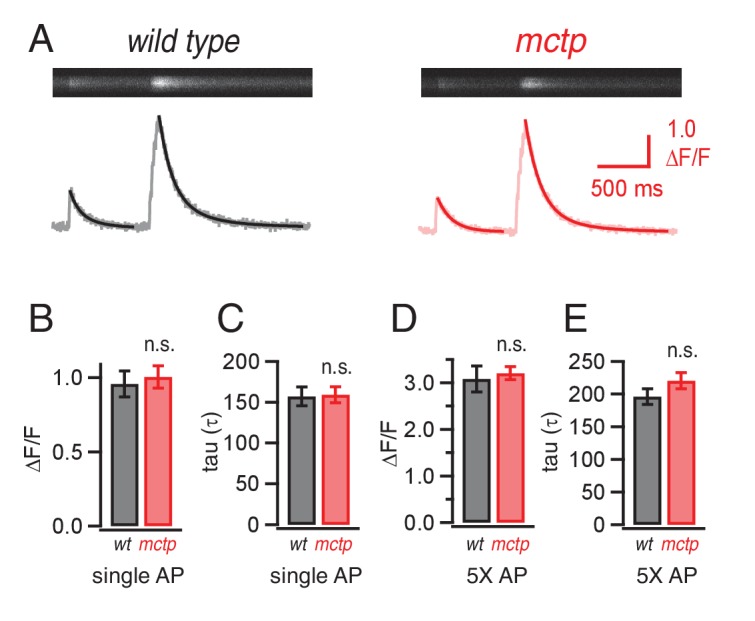
(A) Representative line-scan images at a single synaptic bouton revealing the spatially averaged calcium transients following a single action potential (first stimulus in trace) and a short train of action potentials (5 stimuli at 50 Hz, second stimulus in trace) for wild type (black) and mctpOG9 (red). Below the raw line-scan data are values (∆F/F) reporting the change in OGB-1 fluorescence relative to baseline as a function of time. Trials were separated by 750 ms. (B) Average peak amplitude of calcium transients (∆F/F) for single action potential (single AP). (C) Average decay (tau) for a single action potential for wild type (n = 10 boutons) and mctpOG9 (n = 12 boutons). (D) Average peak amplitudes of calcium transients (∆F/F) as in (B) for the short stimulus train (5X AP). (E) Average decay (tau) as in (C) for trains of five action potentials (5X AP).