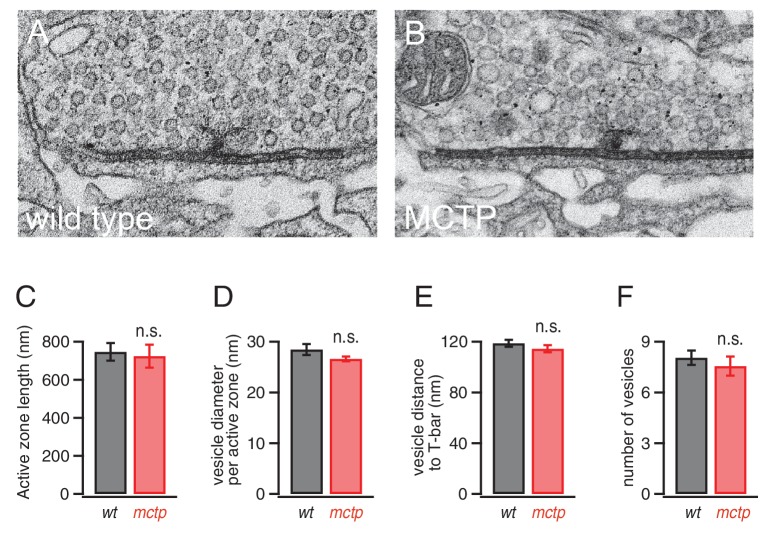
Figure 9. Normal active zone ultrastructure in the mctp mutant.
(A–B) Representative electron microscopy images of an active zone from wild type (A) and mctpOG9 (B). (C–F) Average active zone length (C), vesicle diameter per active zone (D), average vesicle distance to T-bar (E) and the average number of vesicles within 150 nm of the presynaptic T-bar (F). Sample sizes as follows: number of active zones in wild type, n = 19; mctp, n = 16; sections from at least two NMJ in two separate animals. Student’s t-test * for p<0.05; ** for p<0.01, n.s. for p>0.05.

