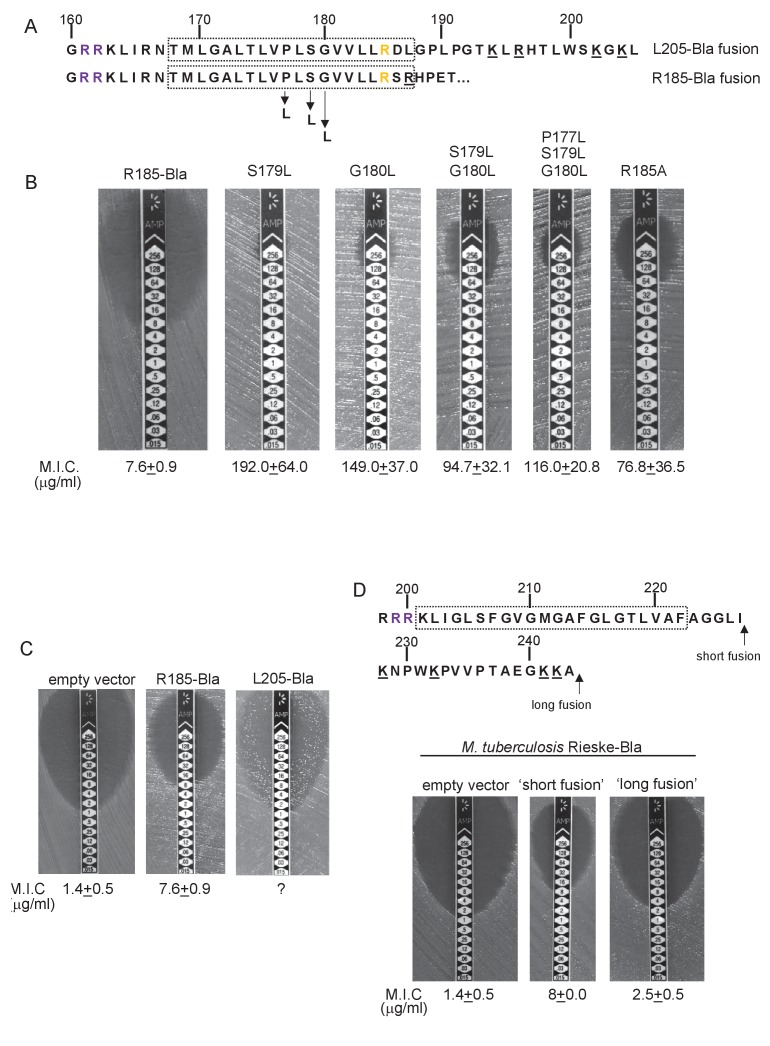
Figure 3. Hydrophobicity of TMD3 and C-terminal positive charges modulate interaction with the Sec pathway.
(A) Sco2149 TMD3 and flanking sequences. Top shows the native Sco2149 sequence up to amino acid 205 (position of the L205-Bla fusion) and below the sequence of the R185 Sco2149-Bla fusion. In each case the predicted position of TMD3 was determined using the SCAMPI2/TOPCONS servers (Tsirigos et al., 2015, 2016) and is shown boxed. The twin arginines are shown in purple and R185 (the position after which Bla was fused in the R185 construct) is shown in yellow. Positively charged amino acids C-terminal to R185 are underlined. (B–D) Representative images of M.I.C.Evaluator strip tests of strain DADE (tat-) harbouring pSU-PROM producing (B) the indicated variants of the R185 Sco2149TMD-Bla fusion or (C) the R185 or L205 Sco2149TMD-Bla fusions, as indicated, or (D) M. tuberculosis QcrA fused to Bla. In (D) the amino acid sequence around TMD3 of M. tuberculosis QcrA is shown, with TMD3 boxed. ‘short fusion’ refers to a Bla fusion after I227 and ‘long fusion’ to a Bla fusion after A243. In each panel the mean M.I.C ± s.d. is given at the bottom of each test strip (where n = 3 biological replicates for each strain).
DOI: http://dx.doi.org/10.7554/eLife.26577.015

