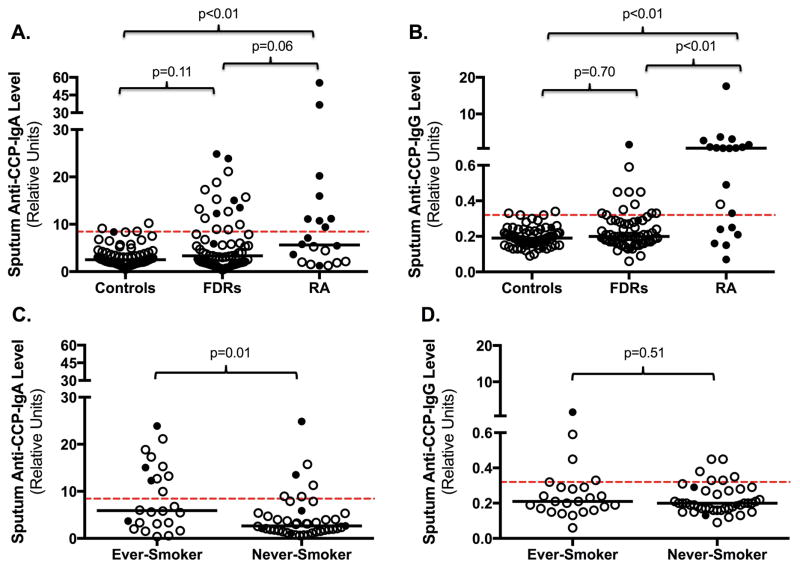
Figure 1. Distribution of sputum anti-CCP-IgA and anti-CCP-IgG levels in all subjects and FDRs stratified by smoking status.
Depicted are the distributions of sputum anti-CCP-IgA (Panel A) and anti-CCP-IgG (Panel B) in Controls, FDRs and RA subjects. Panels C and D depict the distribution of sputum anti-CCP-IgA (Panel C) and anti-CCP-IgG (Panel D) for FDR subjects stratified by ever- or never-smoking history. P-values compare differences in anti-CCP levels between groups using non-parametric testing.
 =Serum anti-CCP-negative for the anti-CCP isotype associated with that panel; ●=Serum anti-CCP-positive for the anti-CCP isotype associated with that panel; ---- Cut-off level for anti-CCP positivity; — Median anti-CCP level.

