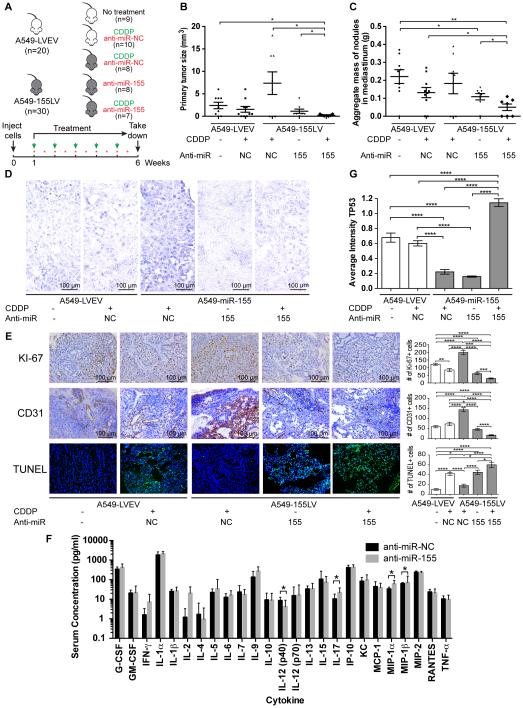
Figure 1. In vivo orthotopic lung cancer model for the role of miR-155 in chemoresistance.
(A) Injection and treatment schedule for CDDP (green arrows) and anti-miR negative control (NC) or anti-miR-155 liposomal nanoparticles (red stars) for five different treatment groups: mice that were injected with A549-LVEV cells and untreated (group 1), injected with A549-LVEV cells and treated with anti-miR-NC and CDDP (group 2), injected with A549-155LV cells and treated with anti-miR-NC and CDDP (group 3), injected with A549-155LV cells and treated with anti-miR-155 alone (group 4), and injected with A549-155LV cells and treated with anti-miR-155 and CDDP (group 5). (B-C) Graphs of the primary tumor size (B) and the aggregate mass of nodules in the mediastinum (C) for each of the five treatment groups. (D) In situ hybridization for miR-155 for each of the five treatment groups. (E) Immunohistochemical analyses for Ki-67 (proliferation) and CD31 (angiogenesis), as well as the TUNEL assay (apoptosis) for each of the five treatment groups. Quantifications are presented in the histograms at the right side of the pictures. (F) Cytokine assay detecting 25 pro-inflammatory cytokines on serum of mice (n=10/group) injected with either anti-miR-NC-DOPC or anti-miR-155-DOPC. (G) TP53 immunostaining for each of the five treatment groups. CDDP, cisplatin; LVEV, lentivirus empty vector; LV, lentivirus; NC, negative control. Error bars represent SEM (panels B, C, E and G) or SD (panel F). Scale bars in panels D and E represent 100 m. The number of mice in each group is indicated.

