
Figure 4. Clinical correlation of miR-155 and TP53 expression with survival in the lung adenocarcinoma – TCGA dataset when distinguishing between TP53 wild-type and TP53 mutated samples.
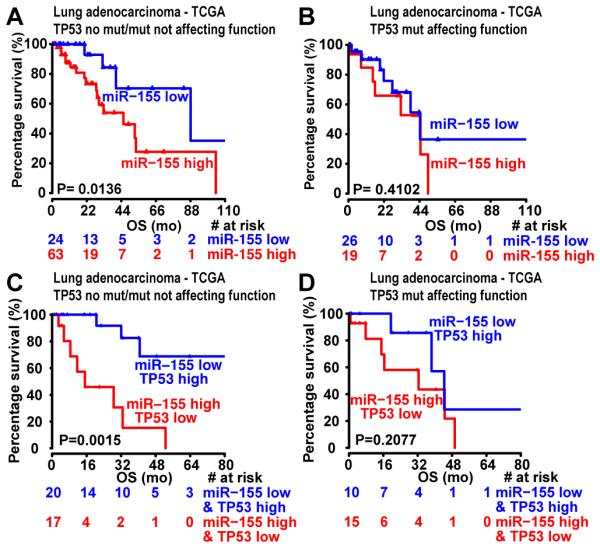
(A-B) Kaplan-Meier survival analysis for patients expressing high levels of miR-155 vs. low levels of miR-155 in samples that express wild-typeTP53 or harbor TP53 mutations that do not affect TP53 function (A), and in samples expressing mutated TP53 that affects TP53 function (B). (C-D) Kaplan-Meier survival analysis for patients expressing high levels of miR-155 and low levels of TP53 vs. low levels of miR-155 and high levels of TP53 in samples that express wild-type TP53 or harbor TP53 mutations that do not affect TP53 function (C), and in samples expressing mutated TP53 that affects TP53 function (D). The red and blue values below the curves represent patients at risk at the specified time points. OS, overall survival; mo, months; TCGA, The Cancer Genome Atlas; mut, mutation.