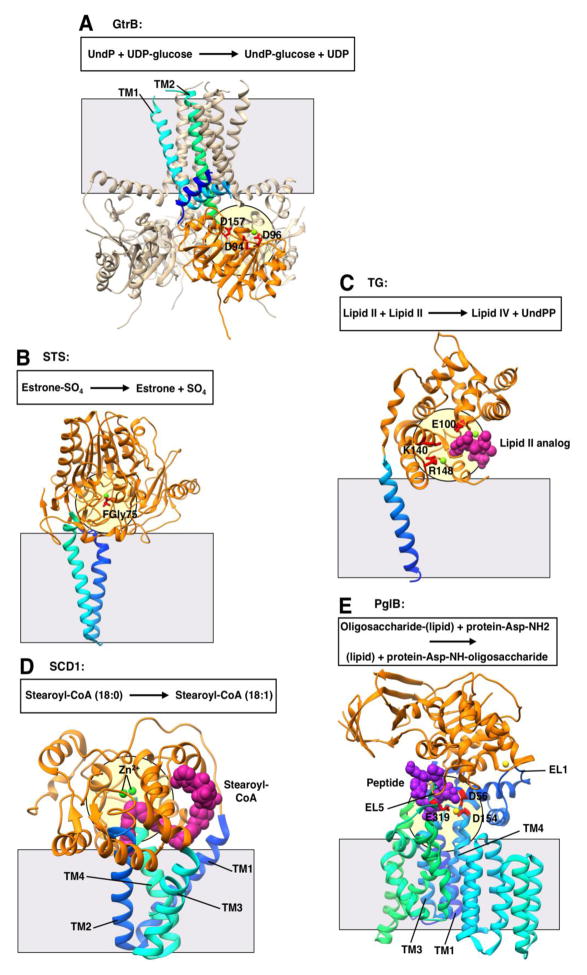
Figure 4. Representative structures showing extramembrane catalysis.
All structures are shown in ribbon representation with bound ligands shown in CPK representation. Transmembrane domains are shown in gradient coloring from the N-terminus to the C-terminus (blue to cyan to green), while extramembrane soluble domains are shown in orange. The grey square shows the approximate location of the membrane border. The pale yellow circle indicates the location of the putative active site. All structures oriented with the cytosolic face of the membrane on the bottom. A. Polyisoprenyl glycosyltransferase GtrB (PDB 5EKP) with putative metal biding and catalytic residues in red. Magnesium ion in light green. UndP, undecaprenyl phosphate; UDP, uridine diphosphate. B. Steroid sulfatase (STS; PDB 1P49) with formylglycine-sulfate (FGly; modified cysteine residue) in red. Calcium ion in light green. C. Transglycosylase (TG; PDB 3VMT) with putative catalytic and metal binding residues in red. Lipid II analog in magenta and magnesium ions in light green. UndPP, undecaprenyl pyrophosphate. D. Stearoyl-CoA desaturase (SCD1; PDB 4YMK) with zinc ions (indicating the di-iron center) in green. Stearoyl-CoA in magenta. E. Oligosaccharyltransferase PglB (PDB 3RCE) putative metal binding and catalytic residues in red. Oligosaccharide acceptor peptide in purple, magnesium ions in yellow. EL, external loop.

