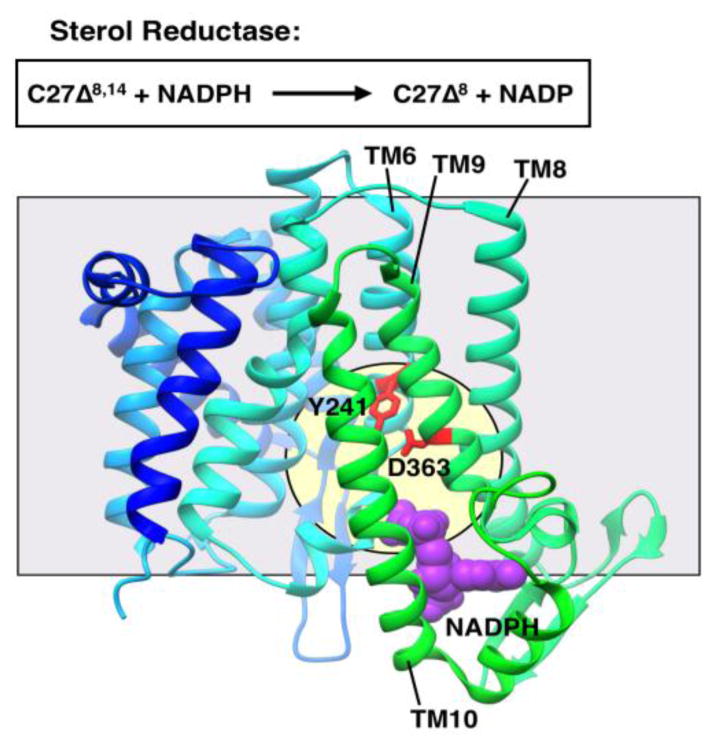
Figure 5. Representative structure showing intramembrane catalysis.
Sterol reductase (SR1; PDB 4QUV) with putative catalytic residues in red. Cofactor NADPH in purple in CPK representation. Structure is shown in ribbon representation colored in a gradient from the N-terminus to the C-terminus (blue to cyan to green). The grey square shows the approximate location of the membrane border. The pale yellow circle indicates the location of the putative active site. The protein is oriented with the cytoplasmic face of the membrane on the bottom.

