
FIGURE 1.
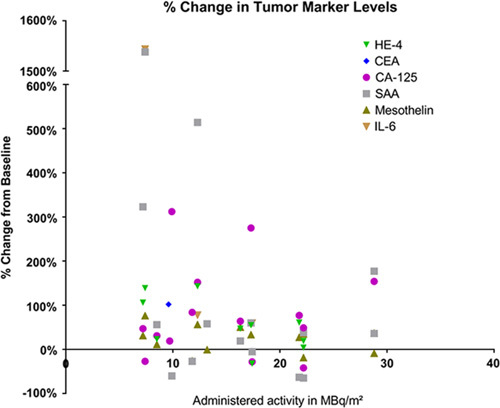
Each data point represents the increase or decrease in serum marker as percent change at 6 weeks compared with baseline for individual patients. The change in markers is compared with administered radioactivity in MBq/m2. Data points are not shown when values were within normal limits.