
FIGURE 2.
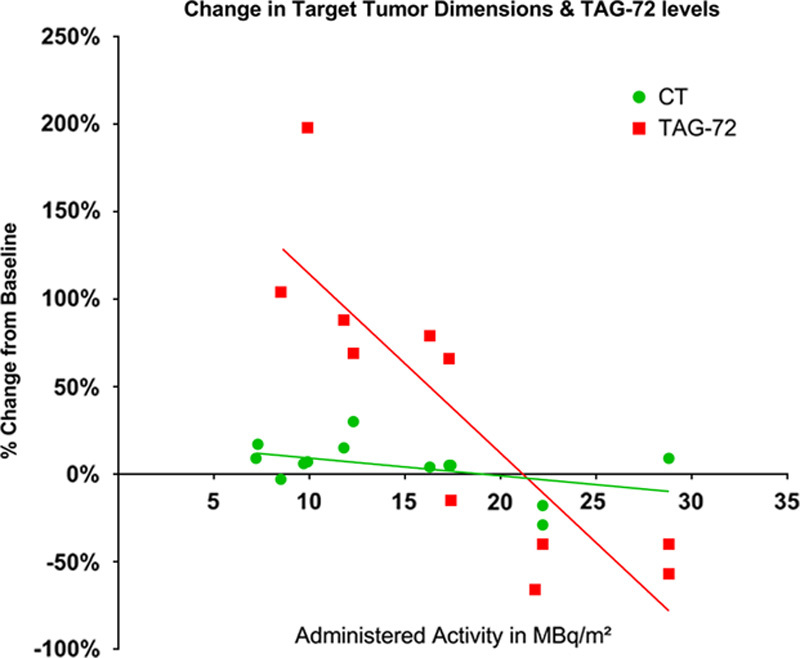
Each data point represents a single patient who had measureable lesions and TAG-72 >6 U/mL at baseline. The data points are expressed as percent change from baseline. The lines represent best fit from regression analysis. TAG-72 indicates tumor-associated glycoprotein 72.