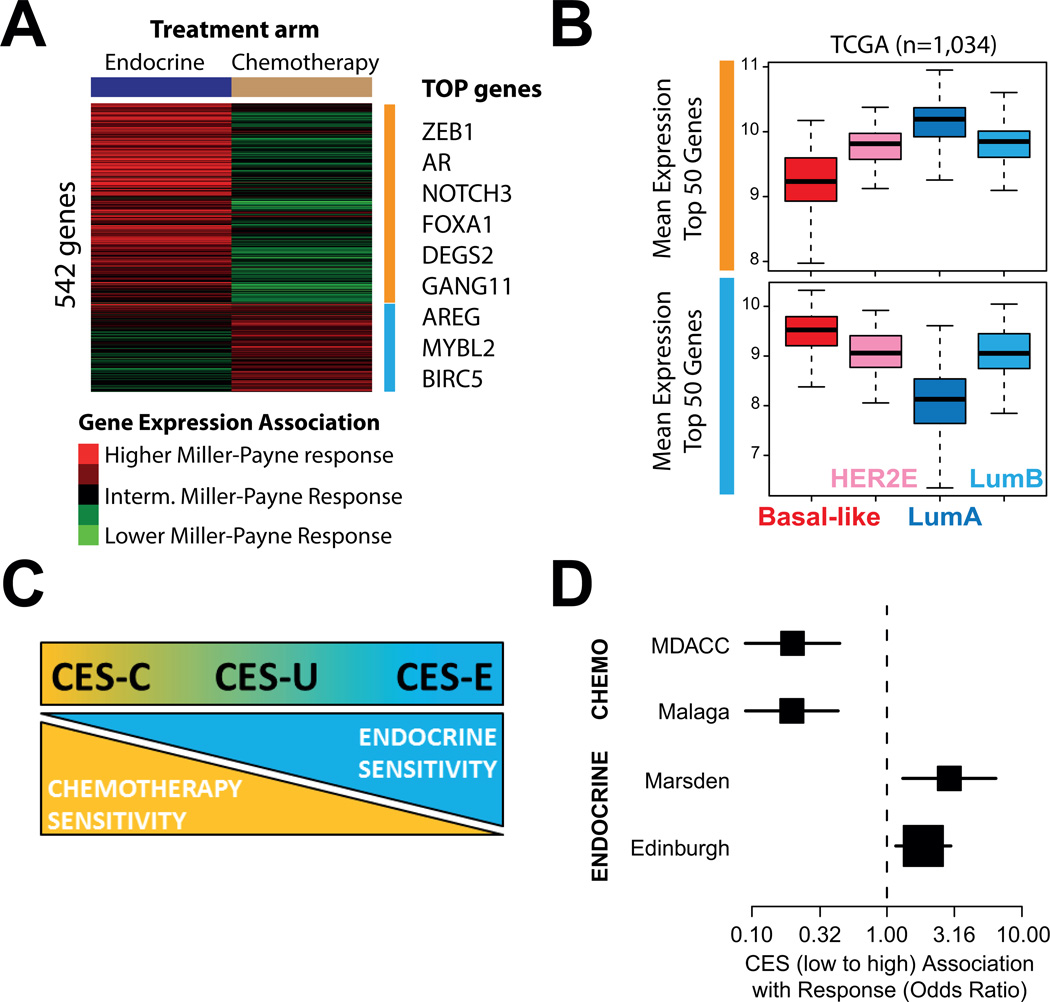
Fig 1.
Gene expression association with either chemotherapy or endocrine therapy sensitivity. (A) Association between the expression of each individual gene (n=542) and Miller-Payne response in each arm of the GEICAM 2006-03 trial. Selected top genes who’s expression is found significantly associated with response are shown on the right. (B) Mean expression of the Top 50 genes associated with endocrine sensitivity (upper panel) and chemotherapy sensitivity (bottom panel) in the GEICAM 2006-03 trial across the intrinsic subtypes of breast cancer. The RNAseq-based gene expression data has been obtained from the The Cancer Genome Atlas breast cancer project data portal (https://tcga-data.nci.nih.gov/tcga/). (C) Significance and scoring of the CES.

