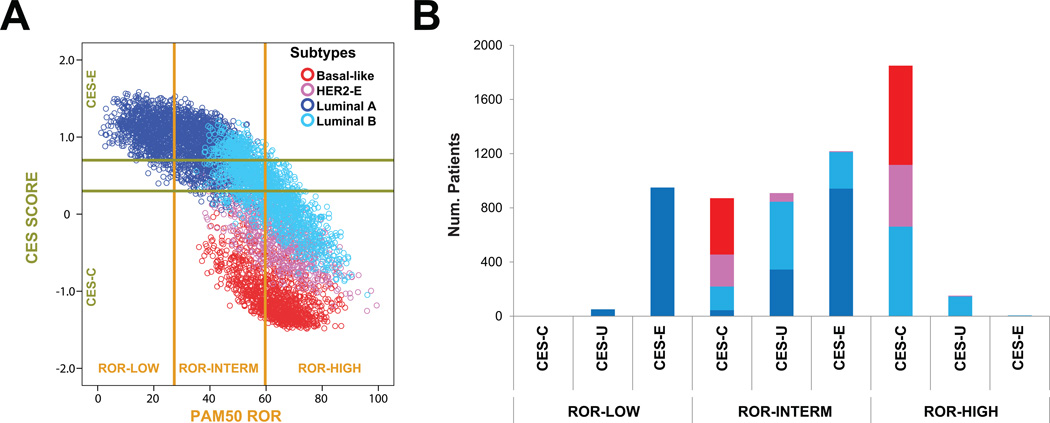
Fig 2.
Prognosis (PAM50 ROR), intrinsic subtype and CES in 6,007 primary breast cancers. (A) A scatter plot of CES score and ROR score, colored by subtype, is shown. The two horizontal lines indicate the cutoffs of each CES group. The two vertical lines indicate the cutoffs of each PAM50 ROR group. (B) Number of patients in each CES group based on ROR. Each bar is colored by subtype.

