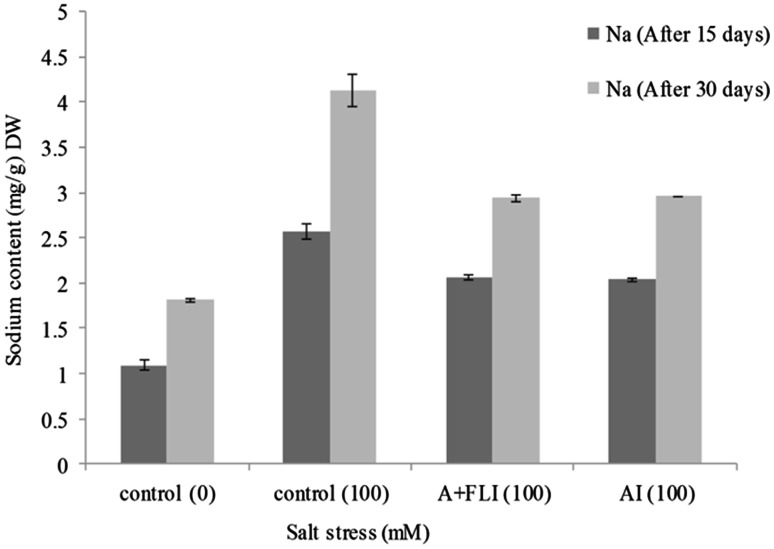
Fig. 10.
Effect of A + FLI and AI on Na+ contents of Triticum aestivum L. in the presence of salt stressor after 15 and 30 days of growth. Control (0) soil with no salinity stress, Control (100) soil with 100 mM salinity stress, A + FLI(100) A + FLI + soil with 100 mM salinity stress, AI(100) AI + soil with 100 mM salinity stress (data are presented as the average of three replicates and p < 0.05 according to Graph Pad software)

