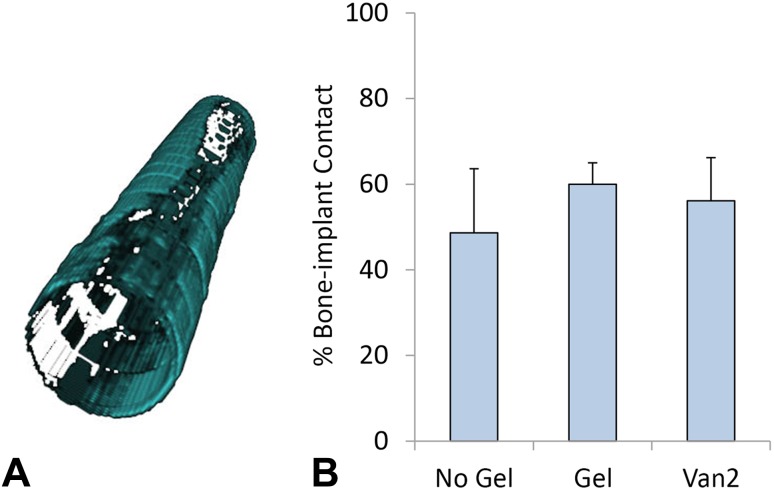
Fig. 2A–B.
The bone volume fraction percentages near the implant surface were measured for all groups using microCT. (A) The bone present within 180 µm from the implant surface is shown in blue-green. (B) No differences were found in the bone volume percentages near the implant of the Gel or Van2 groups compared with the No Gel group. Data are shown as mean and SD.

